04 | In Cab System

In Cab Monitoring Solution for Shovel Operator

In this project, I was tasked with redesigning the ShovelMetrics Gen 3 operator in-cab display to enhance performance and productivity. The goal was to improve the overall UX and UI by creating a more intuitive, efficient, and visually clear interface that supports operators in real-time decision-making.

Wear Monitoring is a real-time solution that tracks shovel tooth length and predicts the estimated changeout time.This enables shovel operators at the mine to proactively schedule replacements in advance.

AI Monitoring

Data Visualization

B2B / SaSS

Visual & Audio Alarm for Payload

Visual & Audio Alarm
for Payload

Visual & Audio Alarm for Payload

The new main page clearly displays the current shovel and truck loads, along with their underload, target, and overload thresholds. Dig force has also been added to the main page, allowing users to view all alarms at once, including audio alerts, directly from the main screen.

The new main page clearly displays the current shovel and truck loads, along with their underload, target, and overload thresholds. Dig force has also been added to the main page, allowing users to view all alarms at once, including audio alerts, directly from the main screen.

Deleting the Loads

Deleting the Loads

Deleting the Loads

Deleting loads is necessary when the operator does not want a particular load to be counted toward the truck. However, in the shaky environment inside the shovel, this action can easily be misclicked. To prevent errors, I added a confirmation dialog to ensure that deletions are intentional.

Deleting loads is necessary when the operator does not want a particular load to be counted toward the truck. However, in the shaky environment inside the shovel, this action can easily be misclicked. To prevent errors, I added a confirmation dialog to ensure that deletions are intentional.

Pausing Load Tracking

Pausing Load Tracking

Pausing Load Tracking

Pausing load tracking allows the shovel operator to temporarily stop tracking when cleaning the bench face, so those loads are not recorded. By introducing this feature, users can minimize the need to delete loads and instead use the pause function to exclude cleaning loads from the data.

Pausing load tracking allows the shovel operator to temporarily stop tracking when cleaning the bench face, so those loads are not recorded. By introducing this feature, users can minimize the need to delete loads and instead use the pause function to exclude cleaning loads from the data.

Navigation and Accessibility Improvement

Navigation and Accessibility Improvement

Navigation and Accessibility Improvement

The GET detection view was previously located on the left alongside the payload information, but I redesigned it to be directly associated with the GET graphics. Users can swipe up and down to access this feature. Other screens displaying statistics are now on separate pages for a larger, clearer view, and users can swipe the right panel to access additional important information.

The GET detection view was previously located on the left alongside the payload information, but I redesigned it to be directly associated with the GET graphics. Users can swipe up and down to access this feature. Other screens displaying statistics are now on separate pages for a larger, clearer view, and users can swipe the right panel to access additional important information.

CHALLENGE

Enhance the Load Visualization and Navigation

Enhance the Load Visualization and Navigation

For this project, I was tasked with enhancing load visualization for shovels and trucks and improving interface navigation to minimize operator interaction and reduce back-and-forth actions. Additionally, I focused on improving the overall UX/UI by making targets larger and more accessible to prevent misclicks caused by the shovel’s vibrations.

Key requirements of this projects were:

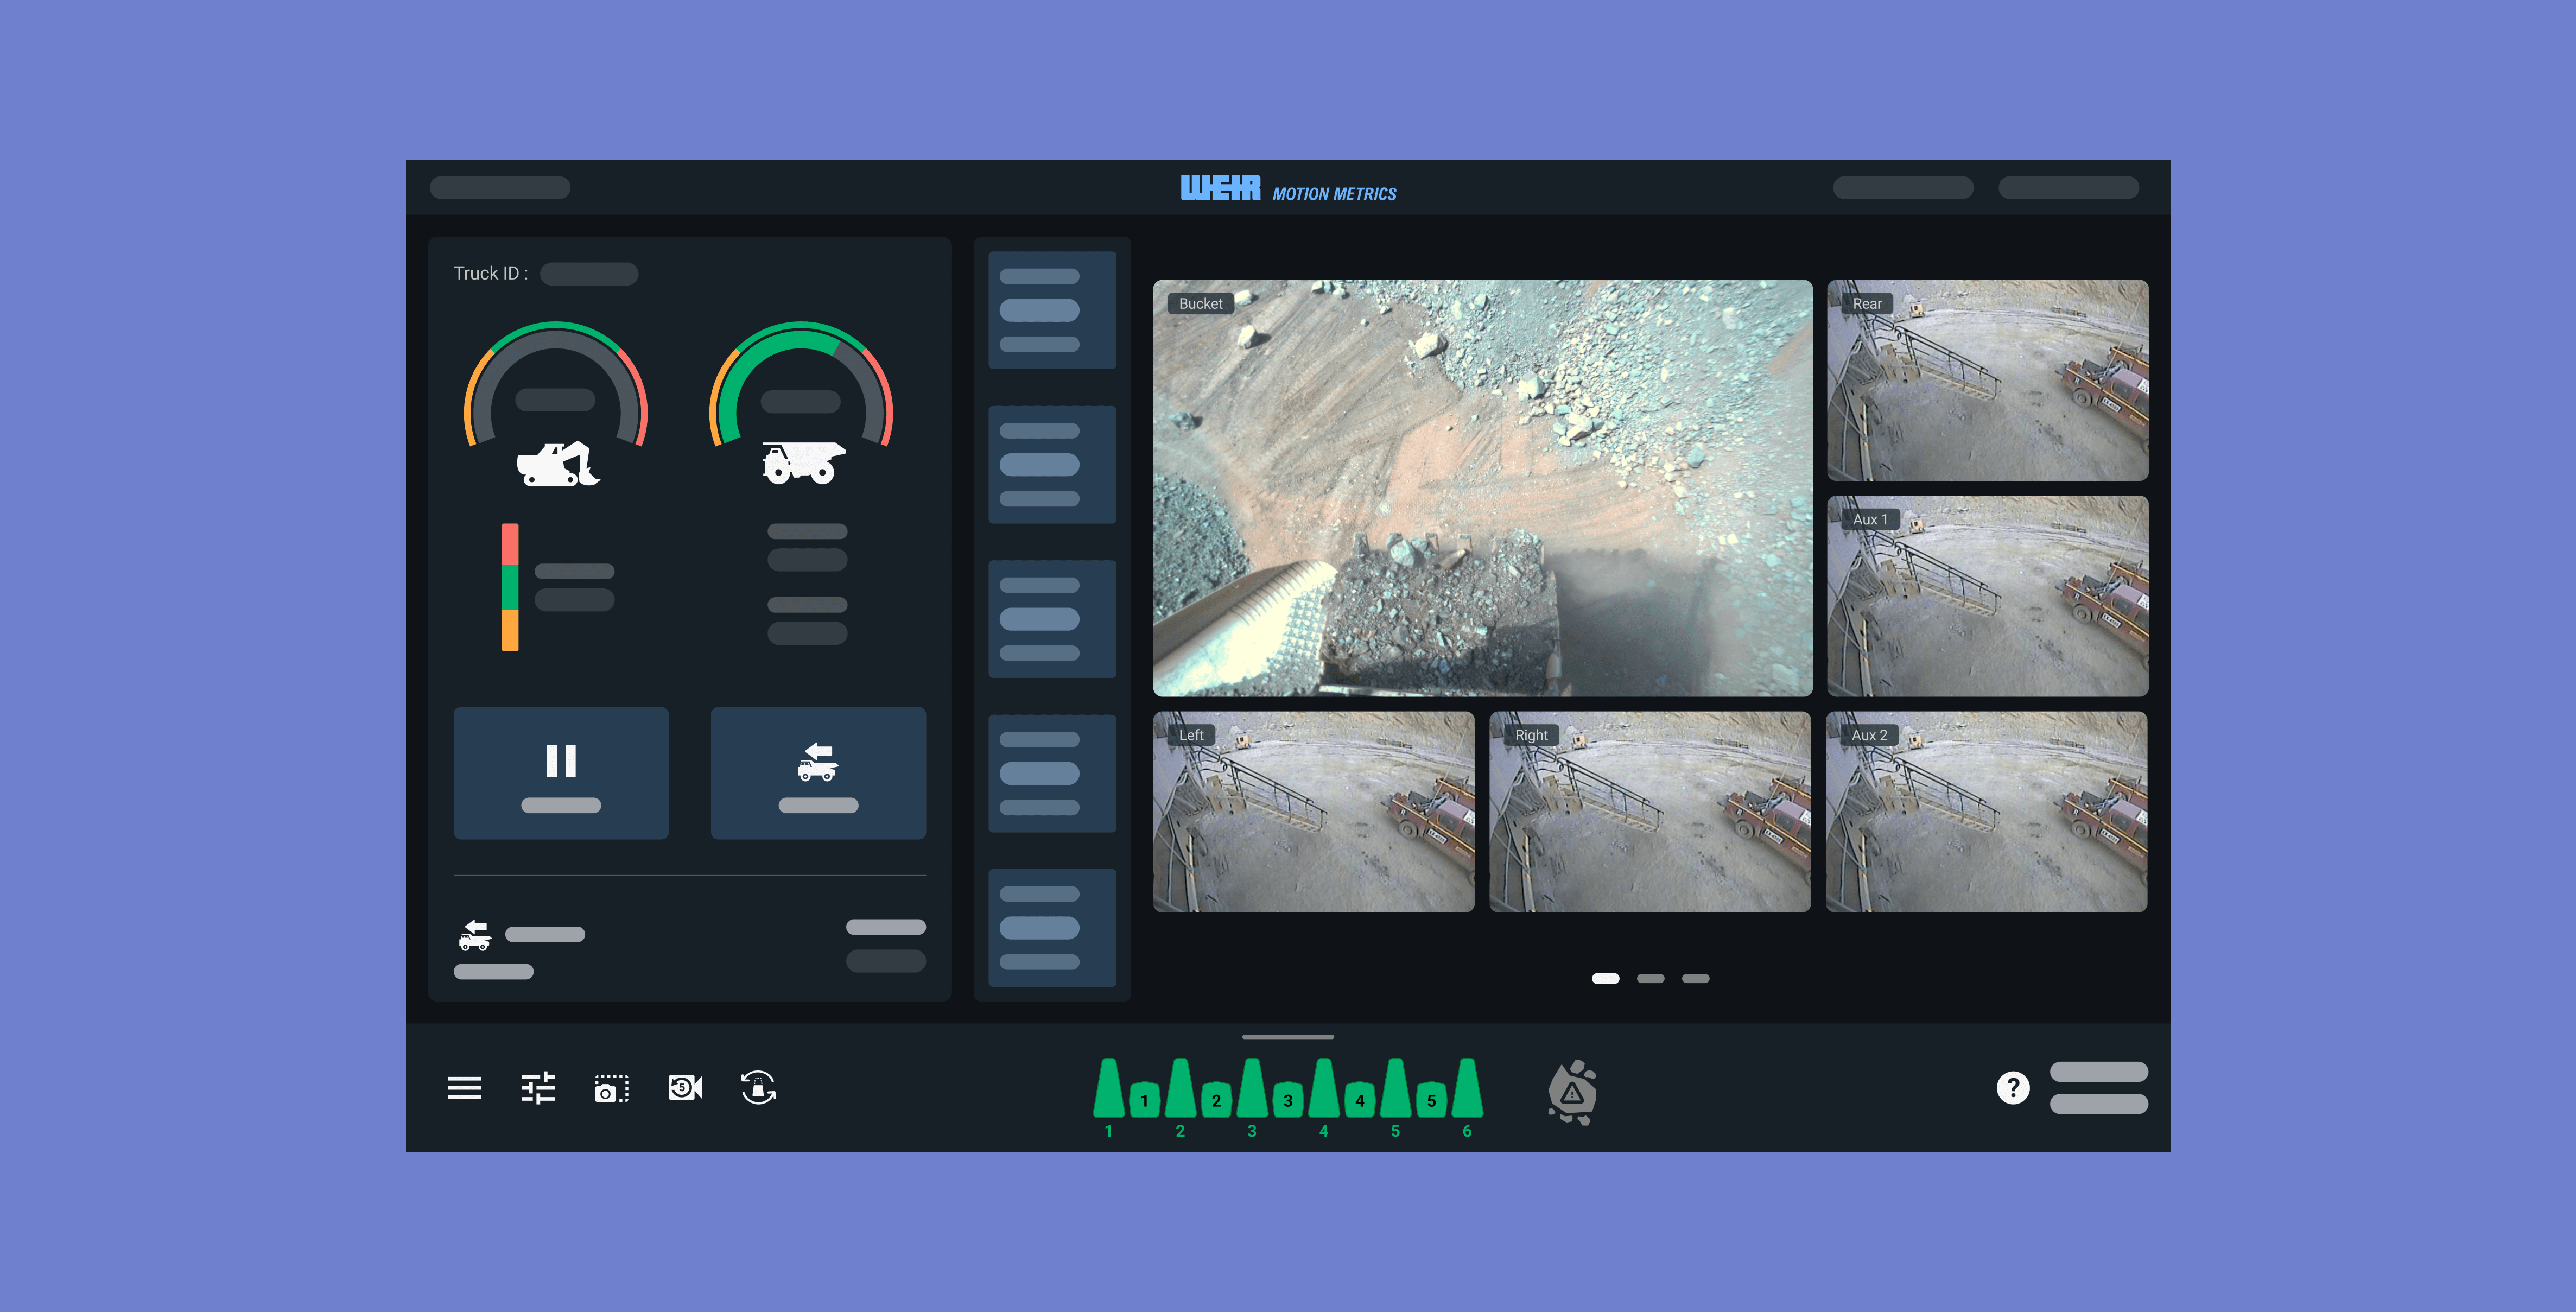
  1. Provide visual indicators for underload, overload, and target levels on both the shovel and truck, accompanied by an alarm sound for underload, overload, and high or low shovel dig force.

  2. Minimize the shovel operator’s back-and-forth interactions by consolidating all essential elements on a single main page.

  3. Enhance overall interface accessibility and reduce misclicks caused by shovel vibrations

My Role

My Role

From August 2025 to October 2025, I worked as the sole designer on the project, handling end-to-end design while collaborating closely with the product manager, robotics engineering manager, and customer success representative to gather feedback and ensure business requirements were met. I also worked closely with software engineers to assess the feasibility of proposed changes.

CONTEXT

CONTEXT

What is ShovelMetrics Gen 3 In-Cab Display?

What is ShovelMetrics Gen 3 In-Cab Display?

What is ShovelMetrics Gen 3 In-Cab Display?

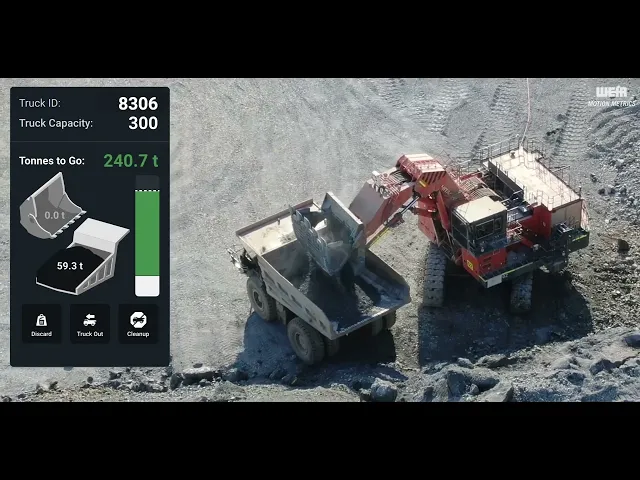
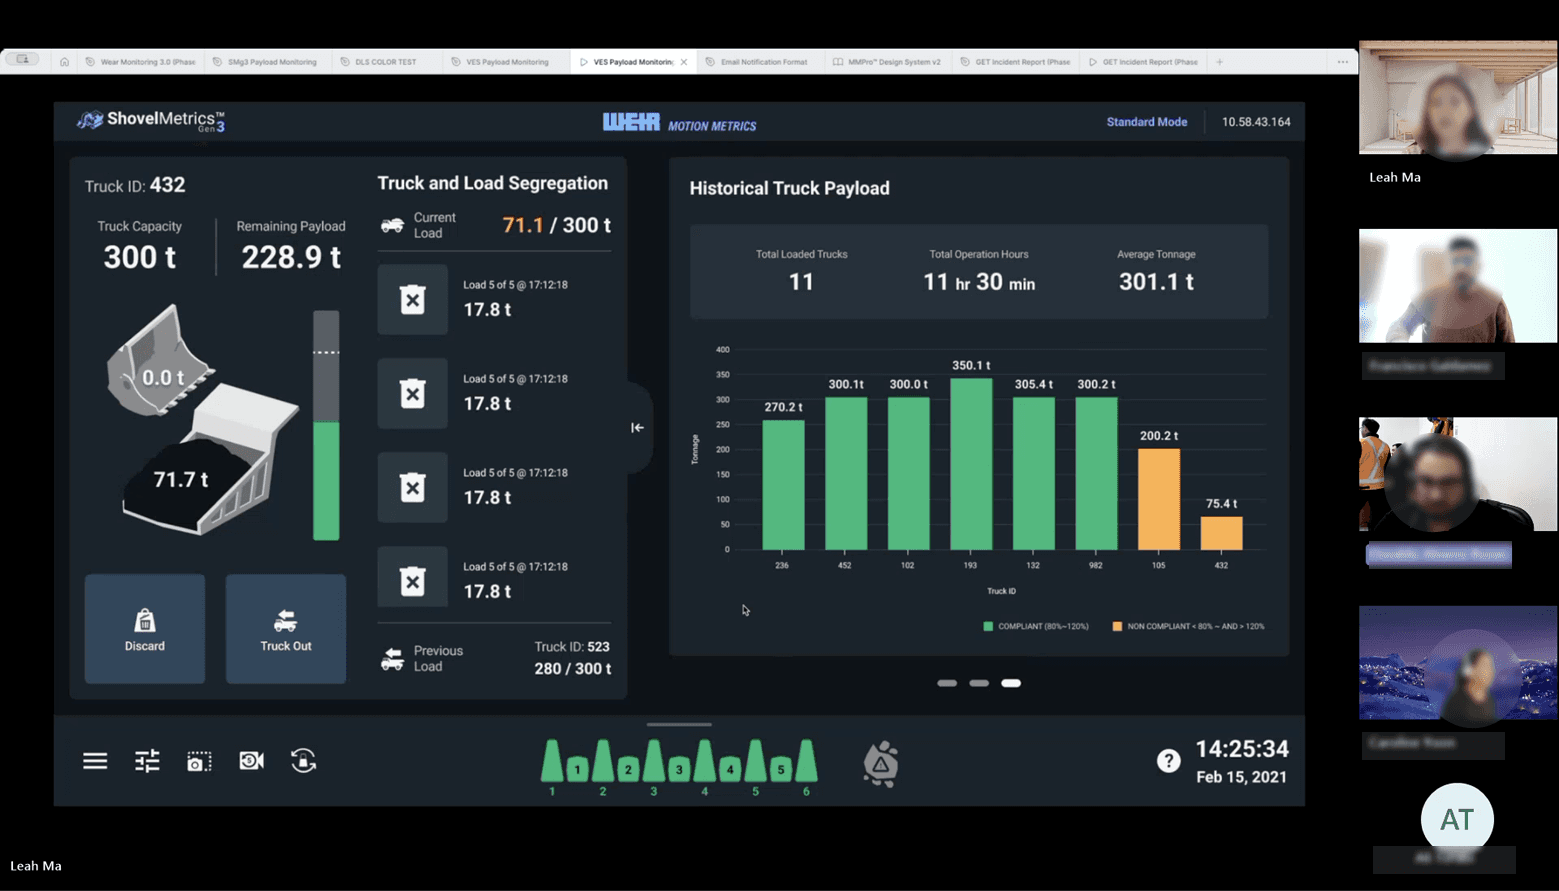
ShovelMetrics Gen 3 In Cab Display gives operators real time insight into bucket health and performance. Using AI cameras, it detects worn or missing teeth, tracks payload, and flags oversized material while delivering instant alerts to improve safety, efficiency, and maintenance

RESARCH

Identifying the Problems

Identifying the Problems

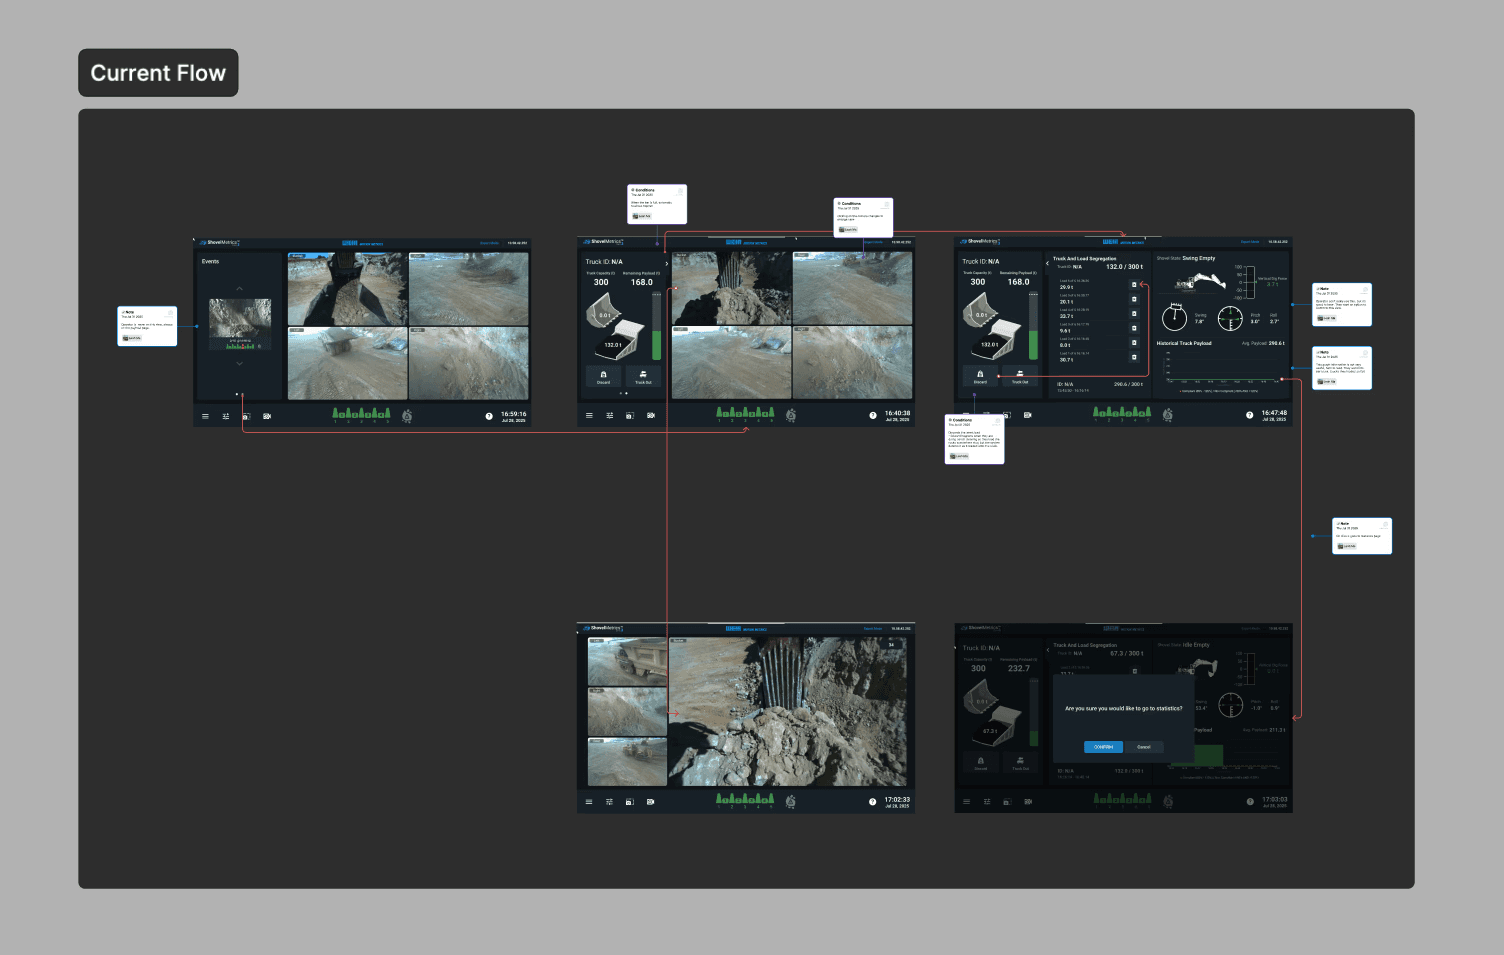
At the beginning of the project, I received a list of customer pain points from the product manager. I focused on empathizing with users and understanding the challenges they faced. Analyzing the current navigation flow was key to identifying opportunities to reduce unnecessary back-and-forth interactions.

RESEARCH

Competitor Analysis

Competitor Analysis

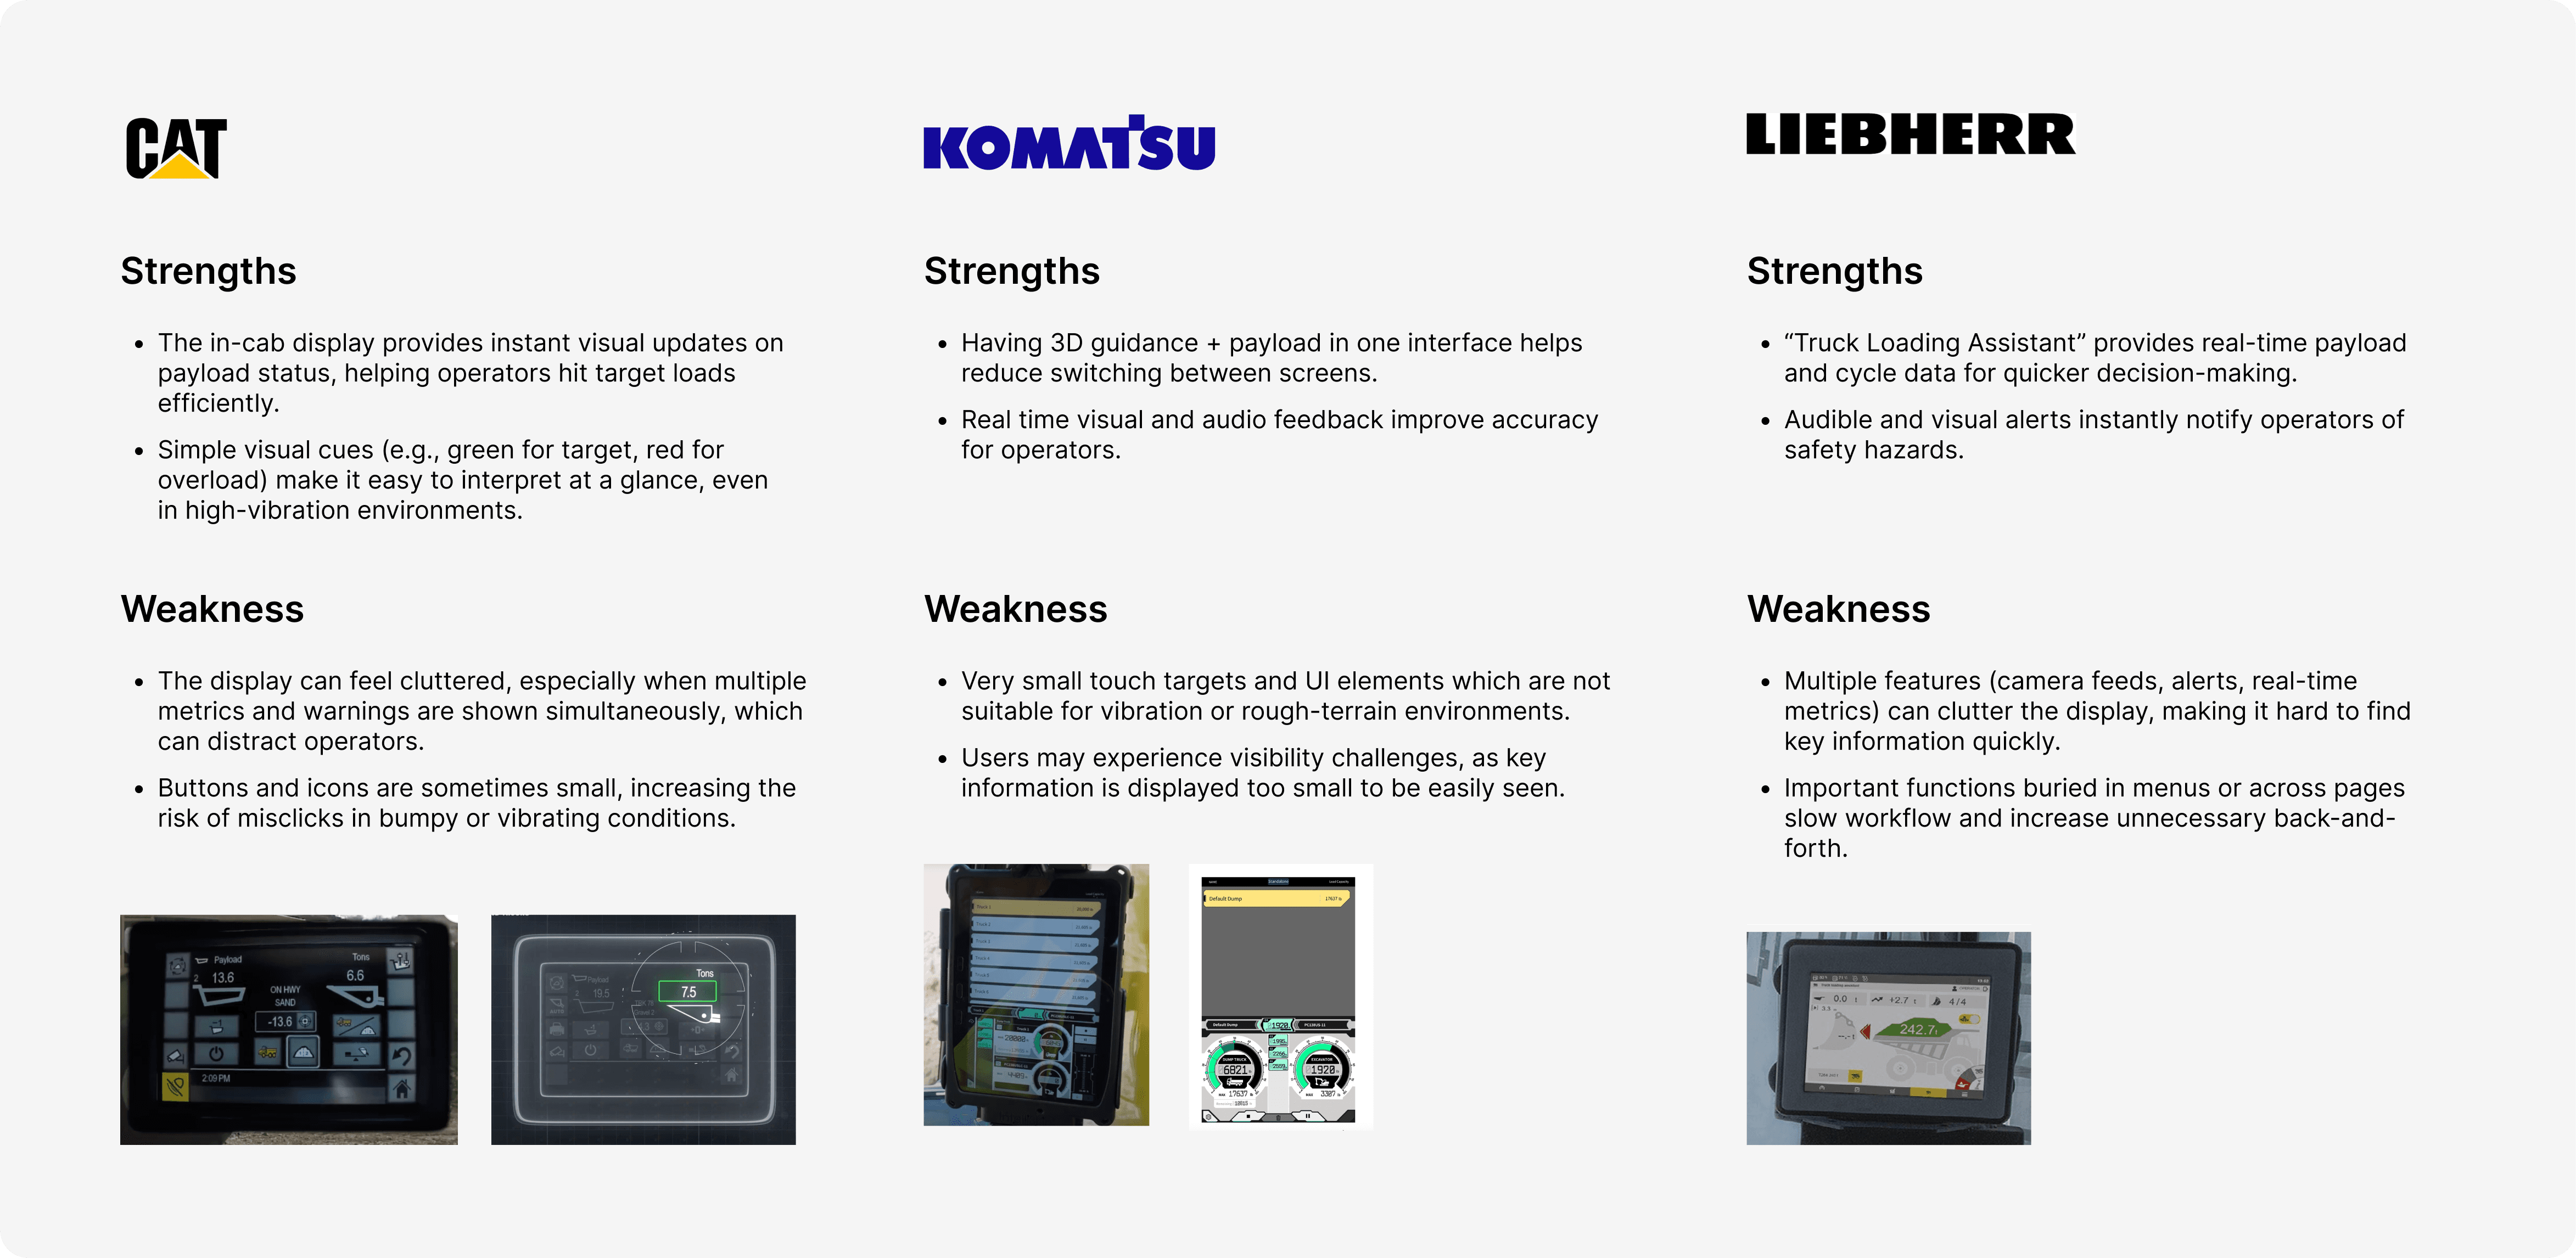
It was also important to analyze our competitors’ products to identify gaps and missing features in our own.
I selected the top three competitors and documented their strengths and weaknesses.

REFRAMING THE PROBLEM

Lack of Empathy Toward the User’s Journey

Lack of Empathy Toward
the User’s Journey

From my research and observations, I realized that the main issue with the current interface is the lack of consideration for the users’ actual workflow. We’re not fully empathizing with how users navigate and interact with the system. It became clear that we need to identify which features and information users rely on most, and reorganize certain elements to enhance the overall user experience.

IDEATE

Planning & Defining MVP

Planning & Defining MVP
During the ideation phase, I began listing all the essential MVP features and sketching out a rough layout of how they could be organized on the interface.
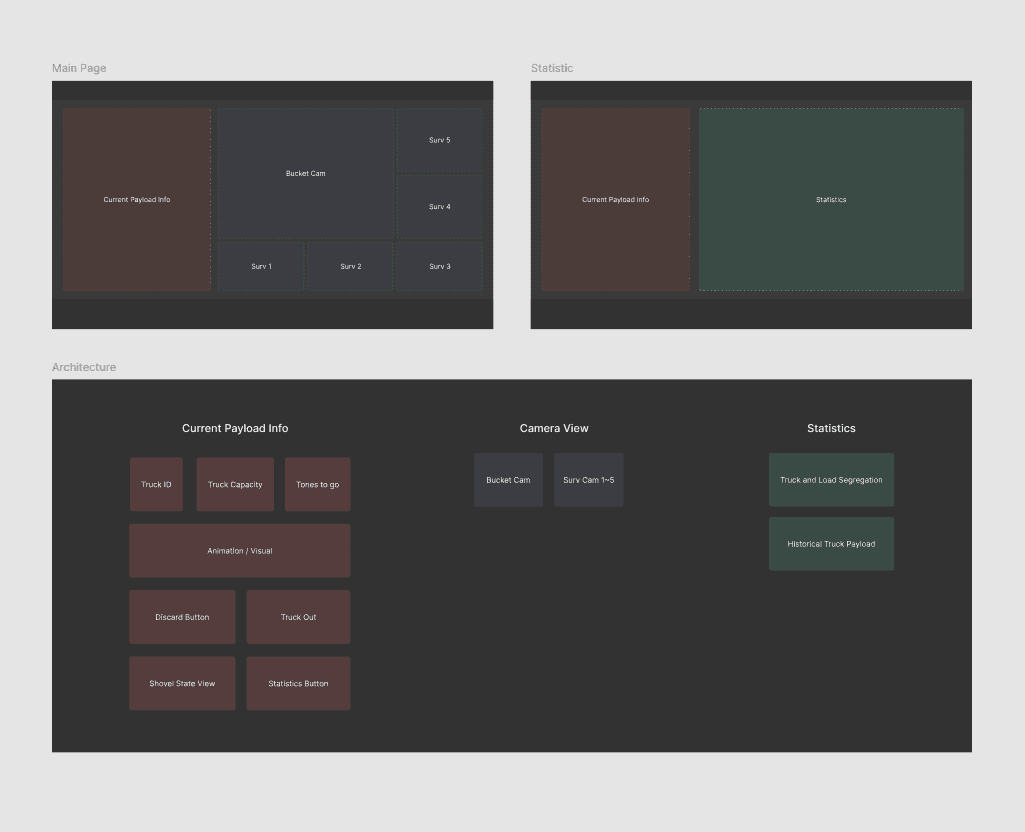
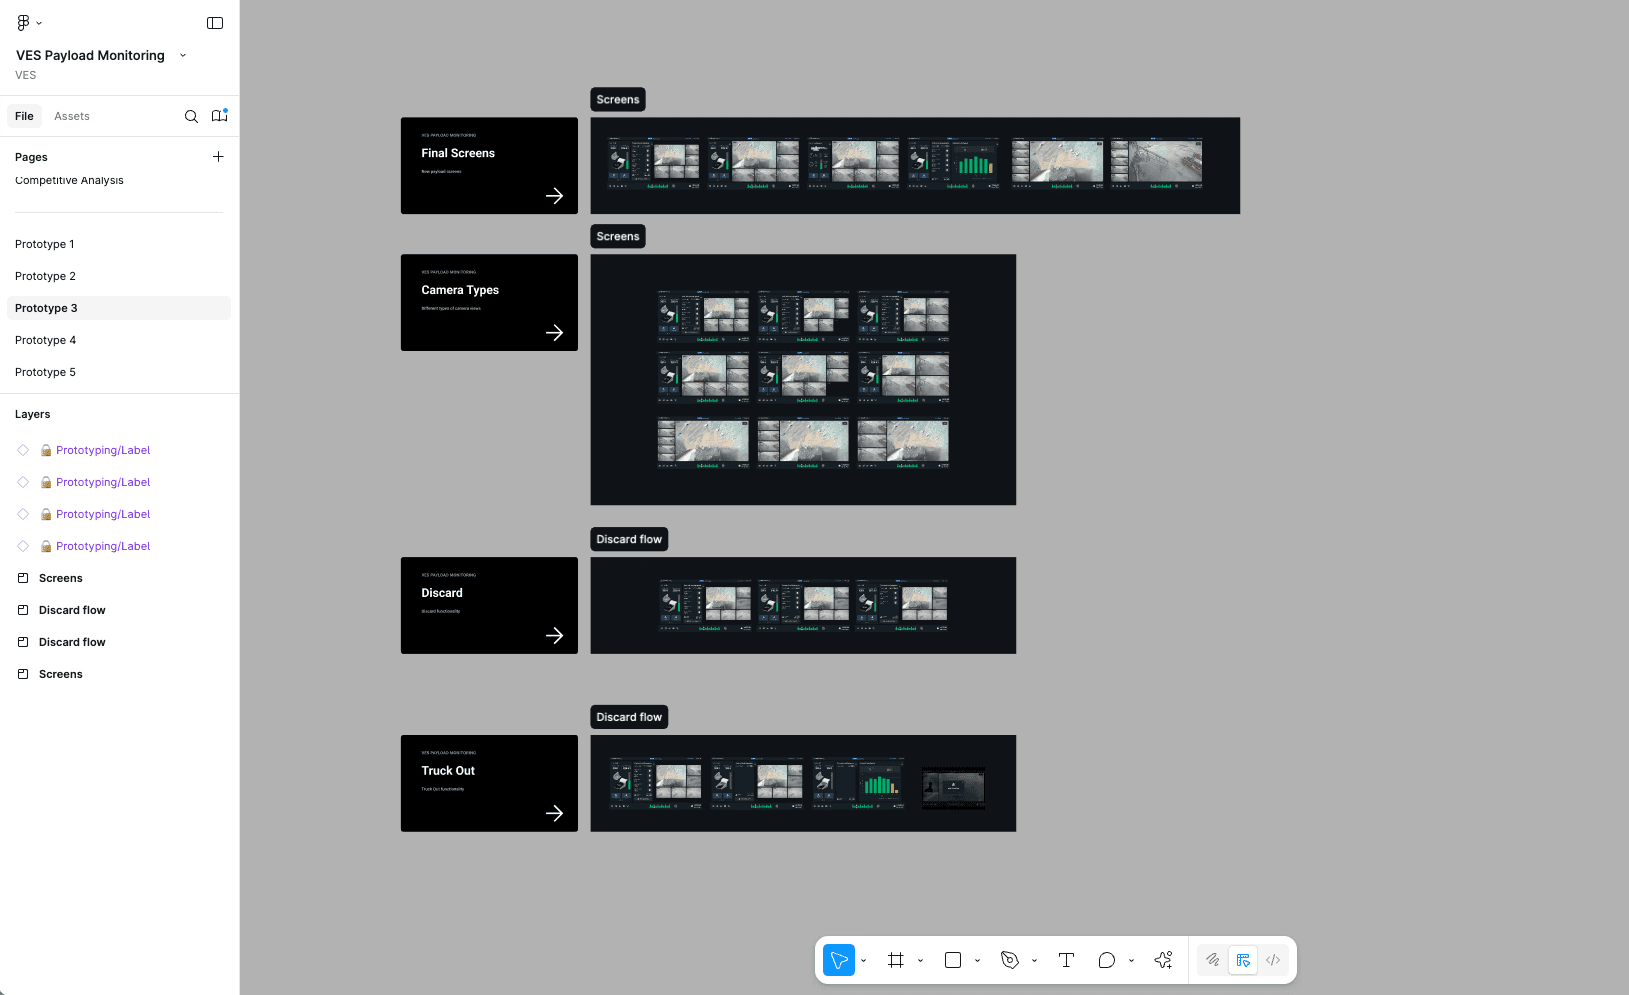
IDEATE

Multiple Design Iterations & User Feedback

Multiple Design Iterations
& User Feedback
During the design phase, I explored multiple design directions and held several feedback sessions. I worked closely with the product manager to ensure our solutions aligned with business goals and addressed real customer pain points. Most importantly, we conducted customer feedback sessions to make sure the design fit seamlessly with the shovel operators’ workflows and needs.

Impact on Business and Users 💡

Impact on Business
and Users 💡

Increased Productivity

By optimizing the user workflow and reducing errors, shovel and truck operations become more efficient, leading to higher productivity.

Reduced Operational Risk

Fewer mistakes in load tracking help prevent costly miscalculations and equipment misuse.

Better Usability

Enhanced accessibility, clear visual indicators, and intuitive navigation streamline the workflow, especially in challenging operational conditions.

What is Next Step?

👩🏻‍💻 More User Testing

Continue to validate the new design by testing it with more shovel operators to gather additional feedback and ensure it effectively meets their workflow and operational needs.

© 2026 Leah. All rights reserved.

© 2026 Leah. All rights reserved.

© 2026 Leah. All rights reserved.